
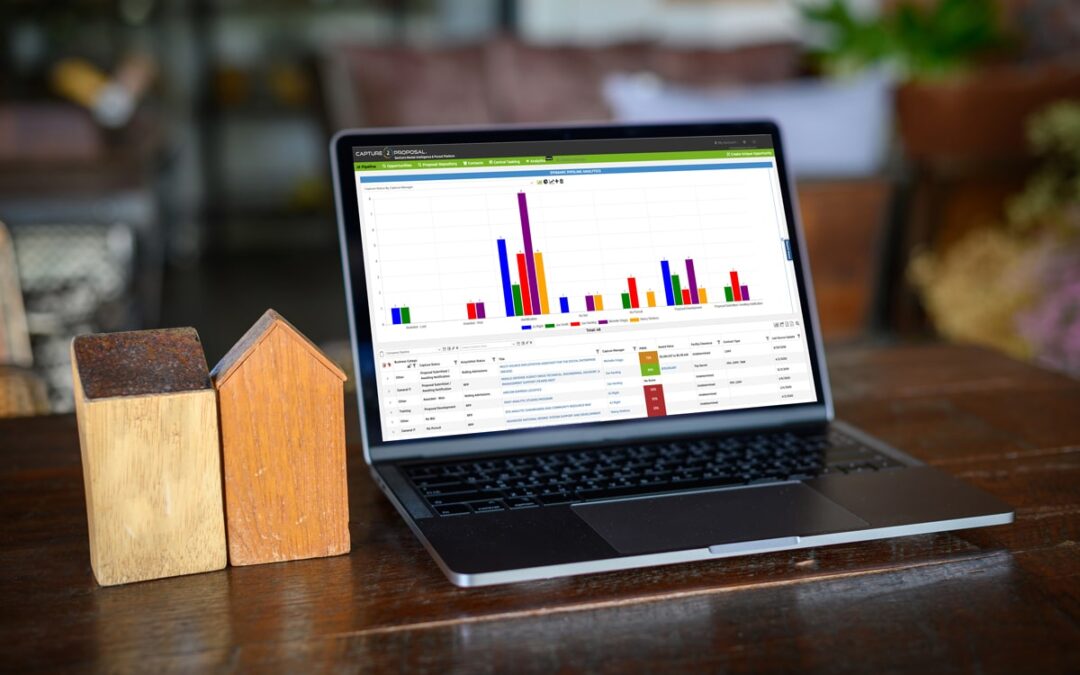
Pipeline Analytics Dashboard:
Determine how your activities affect your results
Want to Learn More?
Contacting Capture2Proposal is easy. We are available on the web, via email, or by phone.
Visualize your GovCon growth KPIs using live pipeline data, any time!
Whether for large or small government sales and growth teams, pursuit management can include a pipeline with many fast-moving, quickly changing opportunities with all kinds of stakeholders, dependencies and resource details. For experienced GovCon sales and BD managers, a complex, dynamic pipeline isn’t something new – it’s something that’s getting more and more difficult to manage as the scale and options for government procurement increase, every fiscal year.
Capture2Proposal has a new tool to help BD sales managers manage this complexity and change, for the highest PWin across the most pipeline growth and ultimately, contract wins. Announcing the C2P Pipeline Analytics Dashboard!
Key Value Propositions

Added Visibility Into Your KPIs
Add, review, compare data on your pipeline! Summarize by award value, Pwin score, or any other numeric or currency field type
 | Capture2Proposal")
Share & Collaborate
Share graphs with your team to keep everyone on the same page
 | Capture2Proposal")
Easy Custom Graph Development
Used in conjunction with pipeline filters you can view data on any dashboard segment you wish to see

Visualize Your Team’s Dashboard
- Our pipeline product features an entire suite of customizable analytics and rich visualization tools, for dynamic, online sales pipeline status and reporting – teamwide. GovCon BD Managers, Directors, VPs can roll up and visually share information from the pipeline critical to their department, portfolio and corporate financial reviews – data that matters most to them. This is a meta-aggregation of quad-chart data and trends, including generation of a standardized or custom dashboard for real-time updates of forecast and actual TCV, bookings, B&P spend, sales and capture expense budgets, gate review status and stage progression.

- Set up custom-tailored graph components for your key metrics using data from both our out-of-the-box fields and your Custom Capture options for endless combinations
- Choose from multiple graph formats, label, legend and other view options
- Save your components for easy access whenever you need them
- Filter your pipeline and the graph will respond to show the correct data based on your current pipeline view – clear the filter and the graph will update again
- Managers can share graphs with their teams to keep everyone on the same page
- Hide or display the dashboard components on the pipeline page based on your current view needs
The popular “Stats at a Glance” feature highlights KPIs most repeatedly used and requested by our own customers. Nearly all data fields available in our opportunity, capture and proposal management database can be used or customized for graphical tracking, such as set-aside type, facility clearance, acquisition status and capture manager. Business Developers on the team can use the analytics dashboard to chart their own progress and opportunities, and to compare their performance to others in their division or among community peers.
Want to learn more?
Sign-up for a brief demo & overview with one of our Capture2Proposal specialists to see it in action!

Pipeline Management Related Content
C2P Pipeline Analytics Dashboard
Capture2Proposal now provides rich, custom analytics visualization capabilities to report and share real-time opportunity pursuit metrics across the sales and BD team, supporting growth KPIs.

Critical 2020 GovCon Market Intelligence Webinar – March 31, 2020 – Winning the Most GovCon Opportunities Online
Pursuit of a government business opportunity is critical to business growth, yet can be very costly in both time and effort. Finding the “needle in the haystack” opportunities that are perfectly aligned with your company’s capabilities, sales lifecycle, and business...

Use GovCon Federal Opportunity & Bid Tracking Tools like Capture2Proposal (C2P) and Avoid Beta SAM Headaches
In the aftermath of the shift to Beta.Sam.gov from FBO.gov (i.e. the FedBizOpps replacement), it’s become apparent that 3rd-party solutions like Capture2Proposal (C2P) are even more critical for the GovCon community to use for finding, tracking and managing Federal...

“How to Win A Government Contract” Webinar featuring Capture2Proposal and Unanet
Capture2Proposal now offers a cost and time-saving automated report generation feature for GovCon sales and capture management decision gates, populating existing company Powerpoint and Word templates with real time information from the C2P CRM and pursuit flow tool.
GovCon CRM & Capture Tools – Auto Gate Reviews, Sales & Pursuit Reports
Capture2Proposal now offers a cost and time-saving automated report generation feature for GovCon sales and capture management decision gates, populating existing company Powerpoint and Word templates with real-time information from the C2P CRM and PursuitFlow tool.